The 12 Vile Vortices and the Vortex Energy Points Map describe a global pattern of strange locations where navigation breaks down, stories repeat, and physical anomalies cluster. This article explains how Sanderson mapped these sites and how later systems expanded his idea into a full energy‑point grid.
This article gives a clear look at Sanderson’s original model and the geometric pattern he believed shaped it. It also shows how modern maps turned these locations into “energy points” and why the idea continues to grow.
The goal is simple: explain the twelve vortices, explain the energy‑point map, and show how the two systems connect without mixing them or rewriting their history.
What are the 12 vile vortices?
This set of twelve locations was identified by researcher Ivan T. Sanderson. He believed these sites formed a repeating global pattern of strange events. His idea was simple: some places on Earth behave in ways that do not match the areas around them.
Sanderson’s model placed five vortices along the Tropic of Cancer, five along the Tropic of Capricorn, and two at the poles. This layout became the base for later ideas about energy points and the map that grew from his work.
Sanderson called these places “vile vortices” because they seemed to pull in odd reports. Ships drifted off course. Compasses spun. The weather shifted without warning. Stories repeated across cultures. He saw these patterns as signs of a deeper structure shaping the planet.
Origins of the concept
The idea behind these sites began with researcher Ivan T. Sanderson. He studied strange reports from around the world and noticed that many of them lined up in repeating bands across the planet. These reports included missing ships, drifting compasses, and sudden changes in weather.
Sanderson believed these patterns were not random. He thought the Earth had natural zones where physical forces behaved in unusual ways. When he mapped the reports, he found twelve clusters.
His model used simple geometry. He placed the vortices along the Tropic of Cancer, the Tropic of Capricorn, and the two poles. This layout created a global grid that looked intentional.
If the same reports repeat across continents, what underlying pattern are they pointing to?
The geometric framework behind the vile vortices
Sanderson believed these sites were not random points on a map. He thought they followed a hidden pattern shaped by the Earth itself. When he placed the reports on a globe, he saw that the twelve sites lined up in a repeating geometric layout.
His model used an icosahedron, a shape made of twenty equal triangles. When this shape was mapped onto the Earth, the corners matched the locations of the 12 vile vortices. This gave him a simple way to explain why the effects of the sites that sat along the same bands of latitude and why they seemed evenly spaced.
This geometric layout later inspired the larger vortex energy points map. These later systems kept the grid-like pattern but changed the meaning. Sanderson focused on physical anomalies. Later maps focused on energy, symbolism, and spiritual interpretation.
Does the icosahedral layout reveal a hidden structure, or just the shape we expect to see?
The 12 vile vortices (sanderson’s original list)
Northern hemisphere vortices (tropic of cancer)
Sanderson’s map was built from reports that repeated across time and place. He grouped the sites by latitude because the patterns lined up along the same global bands. The northern group sits on the Tropic of Cancer and shows the strongest mix of navigation errors and strange weather.
Why do so many unrelated regions along this latitude echo the same strange behaviors?
1. Bermuda Triangle
The Bermuda Triangle is the most well-known of the 12 Vile Vortices. Sanderson used it as a clear example of how ships and planes could drift off course without warning. He believed the mix of magnetic shifts and sudden storms made this one of the strongest on the planet.
2. Algerian Megalithic Ruins
This site sits in the Sahara Desert near ancient stone structures. Sanderson noted unusual heat patterns, strange mirages, and reports of compass drift in the area. He saw it as proof that these sites were not limited to oceans or coastlines.
3. Indus Valley Region
The Indus Valley covers parts of Pakistan and India. Sanderson linked it to sudden weather changes, magnetic irregularities, and long-standing stories of lost travelers. It helped him show that the 12 vile vortices formed a repeating pattern across continents.
4. Hamakulia, Hawaii
Hamakulia is a volcanic zone on the Big Island of Hawaii. Sanderson pointed to its magnetic swings, deep-sea vents, and sudden ocean changes as signs of a vortex. This site later became important in discussions about energy points because of its strong natural forces.
5. Devil’s Sea (Dragon’s Triangle)
The Devil’s Sea sits off the coast of Japan and mirrors the Bermuda Triangle in many ways. Sanderson used it to show that two major vortices existed on opposite sides of the Pacific. Reports of drifting ships, strange fog, and missing vessels made it a key part of mapping.
Southern hemisphere vortices (tropic of capricorn)
Sanderson placed the southern group of the 12 vile vortices along the Tropic of Capricorn. These sites showed the same mix of strange weather, magnetic drift, and repeating reports found in the northern group. Together, they helped form the full pattern for the map.
What makes the southern band mirror the north so precisely in its anomalies?
6. South Atlantic Anomaly Region
The South Atlantic Anomaly sits off the coast of Brazil. Sanderson noted that this area caused problems for satellites and navigation tools. He saw it as a strong example of how vile vortices could affect both the sea and the sky.
7. Zimbabwe Megalithic Ruins
This is an area in southern Africa known for ancient stone structures. Sanderson pointed to unusual magnetic readings and sudden weather shifts in the region. He believed these patterns matched the other sites in his global grid.
8. Wharton Basin
The Wharton Basin lies deep in the Indian Ocean. Sanderson used reports of drifting ships, odd currents, and seismic activity to mark it as one of the 12 vile vortices. Its remote location made the stories harder to confirm, but the pattern fit his model.
9. New Hebrides Trench
This one sits in the southwest Pacific near a deep ocean trench. Sanderson linked it to sudden storms, shifting winds, and navigation errors. He believed the mix of deep-sea forces and surface weather made it a clear site.
10. Easter Island
aster Island is known for its ancient statues, but Sanderson focused on its magnetic irregularities and strange weather patterns. He saw it as a key point in the southern band of energy points.
Polar vortices
Sanderson completed his map by placing the final two sites at the poles. He believed the North Pole and South Pole showed the same repeating signs found in the other zones. These locations helped him show that the 12 Vile Vortices formed a full global pattern on the larger vortex energy points map.
If the poles complete the pattern, what does that say about the forces shaping the entire globe?
11. North Pole
Sanderson saw the North Pole as a natural site because of its shifting magnetic field and extreme weather. Reports of drifting compasses and sudden whiteout conditions supported his view that this region matched the other sites on his grid.
12. South Pole
The South Pole showed similar signs. Sanderson pointed to strong magnetic distortion, unusual atmospheric effects, and navigation problems in the area. He believed these patterns confirmed that both poles belonged to the 12 vile vortices and completed the global layout of his model.
How sanderson described each vortex
Sanderson treated each location as a mix of place, pattern, and physical effect. He looked at the geographic setting first, then at the type of anomalies reported in that area. These included drifting compasses, sudden storms, strange currents, and long-standing stories of lost travelers. He used these repeating signs to decide whether a location belonged on his map.
He also added his own interpretation. Sanderson believed the Earth had natural zones where magnetic and atmospheric forces behaved in unusual ways. When he saw the same signs in different parts of the world, he treated them as evidence of a larger pattern. This approach shaped the early idea of energy points and helped form the base for later systems that focused on mapping them for patterns.
Modern views are mixed. Some researchers look for scientific causes behind the reports, while others question whether the patterns are real at all. But even with debate, Sanderson’s method remains clear: he mapped each location by the stories linked to it and by the physical effects people claimed to see.
Are these repeating signs a coincidence or the signature of a deeper planetary system?
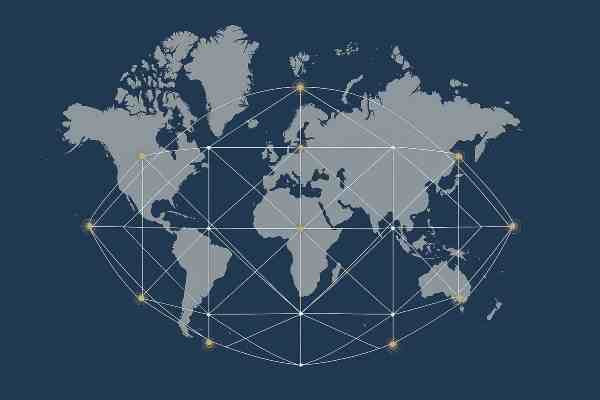
The vortex energy points map
The modern map grew from Sanderson’s original idea but changed its meaning. Instead of focusing on strange reports and physical anomalies, later writers treated the 12 vile vortices as places where the Earth’s energy gathers, shifts, or intensifies. This shift turned a research model into a full energy‑point system.
The new map kept the same global layout. It used the twelve sites Sanderson identified, but it added new language about spiritual influence. Some versions expanded the map even further, adding extra points, ley lines, and symbolic paths across the planet. These additions created a wider network of points that blended geography, myth, and personal experience.
This change also created confusion. Sanderson’s work focused on patterns in nature. The later maps focused on meaning, symbolism, and personal interpretation. Both systems use the same locations, but they do not describe the same thing. Understanding this difference helps readers see how these locations became part of a much larger story about how people imagine the Earth’s hidden structure.
How did a pattern of anomalies transform into a global map of meaning?
Comparing sanderson’s model to the modern map
The shift from the 12 vile vortices to the modern vortex energy points map created two different ways of understanding the same locations. Sanderson focused on patterns in nature. He looked at where reports came from, what people saw, and how those signs repeated across the globe. His goal was to explain why certain places caused trouble for navigation and why stories of strange events kept returning to the same points.
The modern system changed the meaning. Instead of treating the 12 sites as physical zones shaped by weather and magnetism, later writers treated them as places where the Earth’s energy gathers or moves. This shift turned Sanderson’s research into a wider idea about energy points across the planet. The new map kept the same locations but added new layers of symbolism, intention, and personal experience.
These two views overlap but do not match. Sanderson described each vortex by its geographic setting, the type of anomalies reported, and the patterns he believed tied them together. The modern vortex energy points map uses the same sites but reads them through a different lens. It focuses on meaning rather than measurement. Seeing both systems side by side helps readers understand how these sites became part of a larger story about how people imagine the hidden structure of the Earth.
When the same coordinates carry two different stories, which version of the Earth are we really mapping?
Scientific, skeptical, and alternative interpretations
The 12 vile vortices sit in a strange space between science and story. Sanderson tried to explain the reports with patterns in nature, but not everyone agreed with his method. Some researchers looked for simple causes, like storms, currents, or magnetic drift. Others questioned whether the reports were strong enough to support a full global model.
Skeptical views focus on measurement. They point out that compasses can shift near metal, storms can form without warning, and ocean currents can change quickly. From this angle, these sites look less like a hidden structure and more like a mix of natural forces that happen to line up in certain places.
Alternative views take a different path. They use the same locations but read them through meaning rather than measurement. These writers talk about the vortex energy map and its associated symbolic patterns. They correlate it with energy points across the planet. This approach shaped the modern map and turned the original research into a wider story about how people sense and interpret the Earth.
Both views continue to shape how we view these sites and stories that surround them. One side looks for physical causes. The other looks for deeper meaning. Sanderson’s work sits between them, showing how a simple pattern can grow into many different ideas about the hidden forces of the world.
Do these sites reflect natural forces, human interpretation, or the space where the two overlap?
Conclusion
The 12 vile vortices began as a simple pattern in Sanderson’s research. He looked at where strange reports gathered and used those signs to map similar sites across the globe. His goal was not to build a myth but to understand why certain places behaved in unusual ways.
Later writers changed the meaning. They kept the same locations but added new ideas about energy, symbolic patterns, and the presence of energy points across the planet. This shift created the modern vortex energy points map and turned a research model into a wider story about how people sense the Earth.
Both views continue to shape how readers understand these locations. One focuses on nature. The other focuses on meaning. Together, they show how a single pattern can grow into many different ways of imagining the hidden structure of the world.
References
- Invisible Residents: The Reality of Underwater UFOs. Ivan T. Sanderson, 1972.
- Earth’s Magnetic Field. NASA Earth Observatory.
- South Atlantic Anomaly. NOAA Space Weather Prediction Center.
- Geomagnetism FAQ. NOAA National Centers for Environmental Information.
- Bermuda Triangle. Encyclopaedia Britannica.
- The Devil’s Sea Mystery. Skeptical Inquirer.
- What Causes Earth’s Magnetic Field? U.S. Geological Survey.
- Why Is the Earth’s Magnetic Field Weakening? Scientific American.